

Ever heard of Google Analytics but you’re yet to understand or use it well? Then this is for you. Google Analytics offer an easy and free way to track and analyze visitors on your website. You could have thousands or even millions of visitors every month, but those visitors are practically meaningless if you don’t know anything about them.

With Google Analytics, you can track everything from how much traffic your website is getting to where that traffic is coming from and how visitors are behaving. You can even monitor social media activities, track mobile app traffic, identify trends and integrate other data sources to help you make well-informed business decisions. Let’s get started.
How to set up Google Analytics on your website:
Step 1: Sign up for an account. Business owners or executives must first visit the Google Analytics website and register for a new account. To do so, they need to click the “Access Google Analytics” button and follow the instructions given.
Step 2: Set up account properties. These are the details on what Google Analytics will be monitoring, such as websites, social accounts, blogs, mobile apps, etc., and who will have access to all of the data the service provides.
Step 3: Set up the tracking code. For this step, Web developers need to include the Analytics tracking ID and code in their website or mobile app. This allows for service to collect and send usage data to an organization’s Analytics account.
Follow the steps below as well.
- Sign in to Google Analytics with your Google account
- Click the Admin button on the bottom left sidebar of your dashboard
- Select an account or create an account
- Click on the dropdown menu to create a property
- Click on Website and add your site’s name and URL
- Choose your industry
- Choose your time zone
- Click on Get Tracking ID
- Install Tracking ID on your website
Terms used on Your Google Analytics Profile
Account — where each property lives in your dashboard. You can set up multiple properties in one account or have multiple accounts for different properties
Property — the website or mobile app you want to track
Tracking ID — a unique code added to your site that allows Google Analytics to track it
Conversion — visits that turn into customers or potential customers
Channel/Traffic source — shows where your traffic came from, such as referrals or links from other sites, search engines, social media and emails
Session duration — how long visitors spend on your site
Bounce rate — percentage of visitors that view only a single page and then leave
Event — specific visitor behavior, such as when a visitor clicks on an ad, watches or stops a video, downloads a file and more
Landing page — the first page a visitor sees when visiting your website
Organic search — visitors who visit your site from a link on a search results page
Segment — a way to filter data, such as by category and types of visitors
Types of reports you shouldn’t miss:
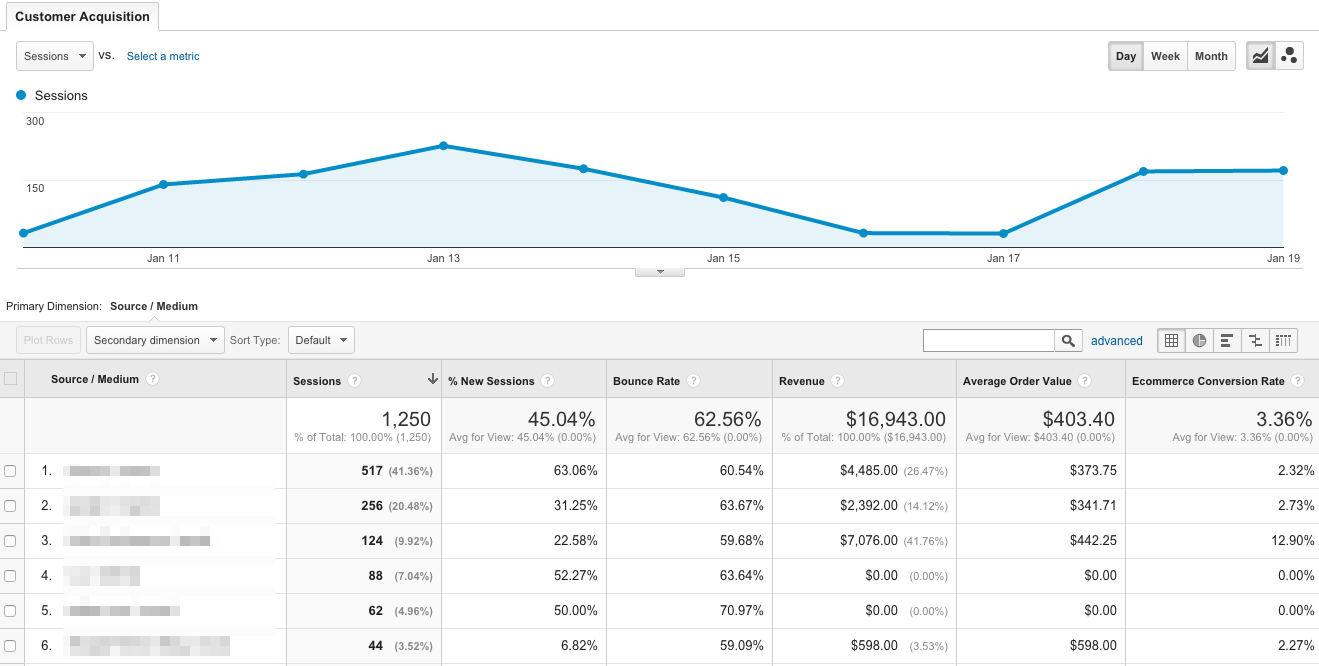
Sample Google Analytics Report
Custom reports allow you to configure metrics based on your own categories that are not included in the default settings. For instance, if you own an online store, this section allows you to track traffic based on things such as size, color and product SKUs. You can also integrate external data sources, such as your customer relationship management (CRM) software. Just click on the Customization tab and create your metrics. Look out for the terms below.
Acquisition — shows you where traffic comes from, such as search engines, social media, email marketing campaigns and links from other websites. You’ll find this under the Acquisition tab.
Keywords — tells you what search words visitors used to find your website on a search engine. You’ll find this report in the Behavior tab, under Site Search.
Conversions — tracks how many visitors are converting into newsletter subscribers, shoppers and actual customers. Click on the Conversions tab and choose a type or category of conversion to view a report.
Lifetime value — currently in beta, Lifetime Value reports track visitors throughout their lifetime, from their first visit to conversions, return visits, future purchases and beyond. This can help you figure out what turned these visitors into customers and what made them keep coming back so you can implement changes. Lifetime value is located under the Audience tab.
Landing page — shows you which pages are the most frequent landing pages so you can track down where those visitors are coming from and what’s working on those top pages that’s attracting customers. You’ll find this across different reports under the landing page column.
Active users — monitors how many visitors are actually active on your site within a specific time period, such as the past week, 14 days or month. This will show you what pages the most active users are visiting so you can figure out what’s keeping their attention and apply it to the rest of your website. You can find the active users report in the Audience tab under Active Users.
— Recommended Read: 6 Best WordPress Plugins for Your Website
— Recommended Read: How Website Traffic Contributes to Your Success
Installing The Tracking Code
A <script> tracking code is required to track your website. You’ll be taken directly to the Tracking Code section after setting up your account. The tracking code must be on every page you wish to track. If you’re using WordPress for your website, then setting this up should be fairly simple.
—– Recommended Read: See 7 WordPress Plugins for Musicians
By basing your website strategy on insights you learn from Google Analytics, you can more effectively grow your traffic and save time in the process.
Questions? Hit us up on Social Media.